


When it comes to monitoring website traffic or running a paid advertising campaign, Google Analytics is an invaluable tool in understanding performance. If you are a business owner working with a digital marketing company, there is a good chance that they will send you a monthly analytics report detailing the performance of their work. However, the metrics outlined in the report may not be immediately clear to someone without an understanding of digital analytics; reading numbers and percentages next to terms such as “bounce rate” and “exit rate” may leave you confused.
With so many similar sounding terms on your analytics report, it is important to understand the differences between them. While there seem to be countless nooks and crannies when it comes to Google Analytics, we will focus on some of the more common terms you may see.
What are Metrics in Google Analytics?
First, we need to clear up what exactly “metrics” means. According to Google, metrics are the quantitative measurements that track website performance. This differs from dimensions, which are non-numerical attributes about the data, such as city or operating system.
Definitions of Common Google Analytics Metrics
Average Session Duration is determined by dividing the total duration of all sessions by the total number of sessions. Generally, a longer average session duration indicates that users are more engaged with the website. Longer page content and embedding videos are two ways to increase average session duration.
Entrances are counted only on the first page that a user visits when going to the website. It is expected that entrances are less than sessions as a user can visit multiple pages on a website during a session. A high number of entrances indicates that a page is often the first page that a user lands on when they visit the website.
Pageviews is the metric to determine how many times a page was loaded in a browser. If a single user refreshes a page multiple times, each refresh will count as a pageview. On the other hand, a Unique Pageview will count multiple refreshes of a page during a session only once.
Sessions are the totality of someone’s visit to a website. Sessions may contain multiple page visits or conversions. By default, a session lasts until a user goes 30 minutes without activity on the website. If a user were to visit a website, leave, and return less than 30 minutes later, it would be counted as one session. Pages per Session is the average number of pages that a user views during a single session.
Users are people that visit your website and trigger analytics. A single user may have multiple sessions. Users may be new (visiting the website for the first time) or returning (already with the analytics cookie stored in their browser).
Bounce Rate vs. Exit Rate
Bounce Rate is determined by dividing single page sessions by all sessions to calculate users who visited one page and then left the website. It is important to note that a high bounce rate is not automatically a bad thing and depends on the context of the page. A page that acts as a hub to other pages, such as a homepage, should ideally have a low bounce rate. On the other hand, a blog post or landing page for an ad can achieve its purpose while having a high bounce rate.
Exit Rate is determined by the percentage of time a page was the last page of a session. This differs from bounce rate which counts only pages that were the only page of a session. This one may be difficult to understand, so refer to Google’s Exit Rate vs Bounce Rate guide for more information.
Understanding Different Google Analytics Reports
Depending on your marketing objectives, you may need access to information in different contexts. Questions such as “who is visiting my website”, “how do people get to my website”, and “what do people do on my website” all require different reports found in Google Analytics.
Audience Reports
Audience data in Google Analytics provides information about the type of people visiting your website. Data provided about your website audience is broken down into dimensions including language spoken, location (country & city), the browser they were using, the type of device they were using, and more.
Examples of questions that may be answered using audience data in Google Analytics include:
- How many sessions did we get from users in Buffalo, NY?
- What was the bounce rate of users on Google Chrome as opposed to Safari?
- Did we get more conversions from desktop users or mobile users?
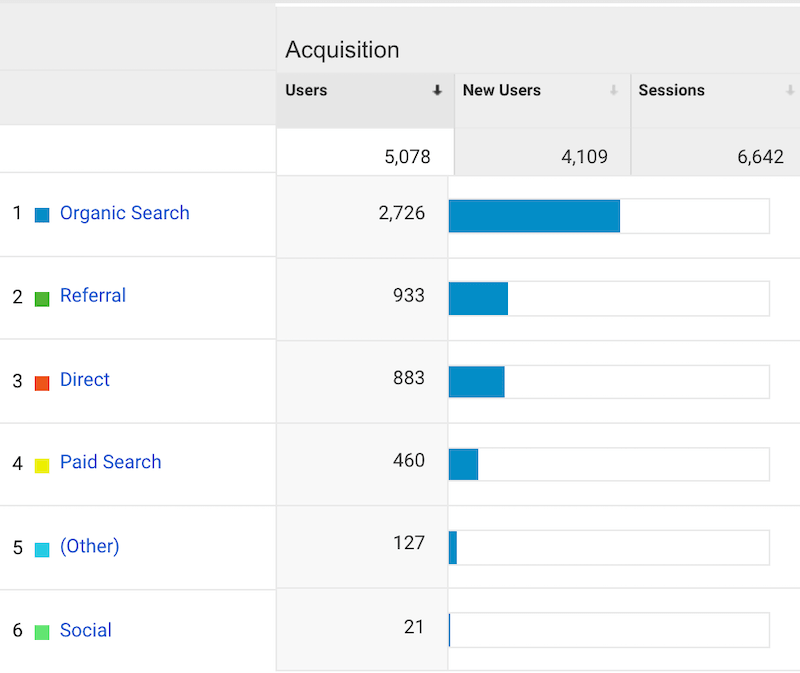
Acquisition Reports
Acquisition data focuses on explaining how users arrived to your website. Some of the most common acquisition methods include:
- Organic Search – users that came to the website from searching in a search engine such as Google or Bing. High amounts of organic traffic are a good sign that SEO services are working well.
- Direct – users that typed in your website URL and came directly to your page. Direct traffic is often repeat website visitors or someone that saw an advertisement for your website.
- Referral – broadly refers to traffic that came from clicking a link to your website that was placed on another website. For example, if a blog links to your website and someone clicks that link, it counts as referral traffic.
- Paid Search – users that came to your website by clicking a paid advertisement, such as display ads or search engine ads on Google.
- Social – traffic that stems from a user clicking a link to your website from a social media platform such as Facebook, Twitter, or LinkedIn.
- Other – a miscellaneous mix of users that do not fall into a predefined category; may be caused by improper tracking code.
An acquisition report from Google Analytics can answer questions such as:
- Where are my users coming from?
- Do organic visitors or direct visitors stay on the website for longer?
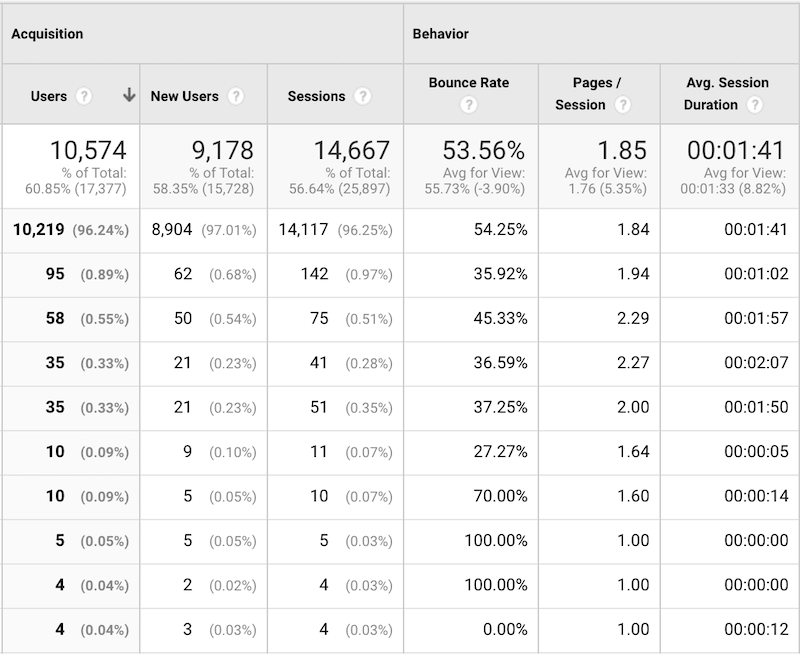
Behavior Reports
Behavior data details how users interacted with your website once they got there, such as what pages they visited or if they completed any events that may have been set up. The behavior tab in Google Analytics also contains a behavior flow which shows the journey that users take once they arrive to the website.
By using behavior data, you can answer questions such as:
- Which of my pages have the most views?
- Where do users that land on my home page click to next?
Need Help Understanding Your Google Analytics Data?
With all of the information provided in Google Analytics, it’s easy to get lost in the data. It’s also important to work with a team that can take the data that Google Analytics provides and utilize it to the fullest extent. If you need help putting your data to good use, or need analytics set-up for the first time, J. Fitzgerald Group is here to help. Contact us today to get started.