


There are many different ways to get to any given destination. Let’s say you want to go to a new restaurant on the other side town. You could take the highway to get there fast, or take surface streets to avoid potential traffic. No car? Jump on a bus or train, or hail a cab or rideshare. Want a little exercise? Maybe a bike trip there would be the perfect option.
How you get there usually doesn’t matter to the restaurant – they’re happy for your business and glad to serve you. But it’s different on the web. Knowing how your website visitors found and arrived at your site can tell you a rich story of your marketing efforts – what’s working, what’s not working and what channels are performing best. So, let’s take a page from classic Americana, and do the “Cotton-Eyed Joe” to find out where did they come from – and where did they go.
Looking at Your Website Analytics
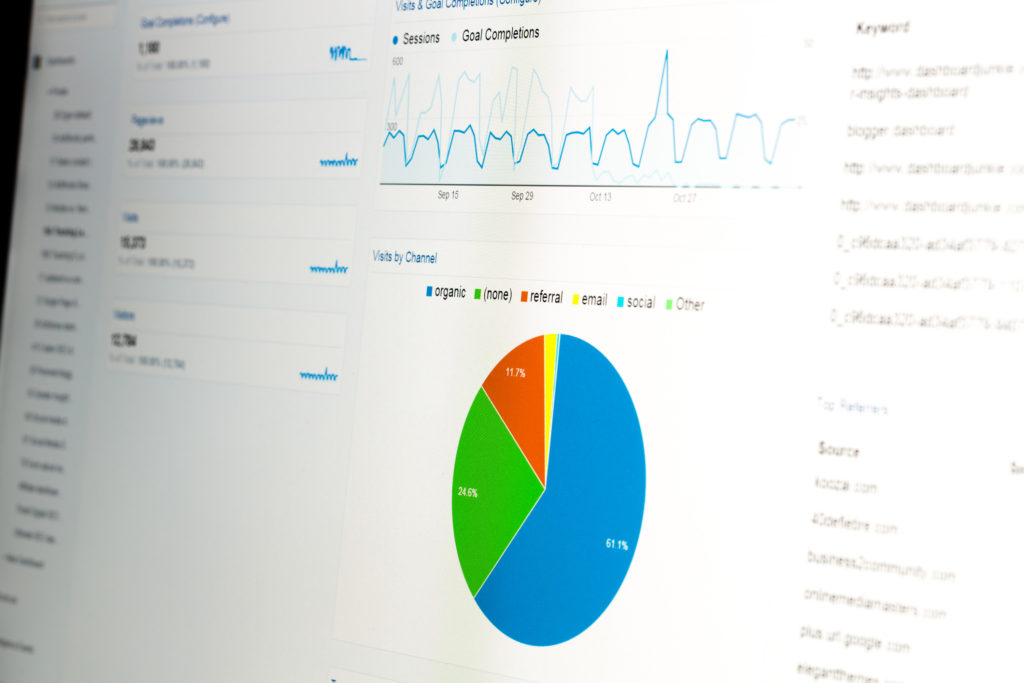
Most site owners have some kind of analytics tracking utility on their site to gauge traffic and interactions, most commonly Google Analytics. These tools provide a wealth of information for you to review – to the point of being overwhelming at points. This includes the raw stats of numbers of sessions, numbers of visitors, bounce rate and more – but also should include data on your traffic sources.
If you’re in Google’s platform, you can find this most easily on the Acquisition tab. Here you’ll find a number of different channels broken out to account for all the users who visited the website during the specified period. Depending on your efforts, there may only be three or four options here, or there may be several. But what does each mean?
What Are the Different Google Analytics Channels?
Organic Search
Often one of the major categories – if not the top one – will be Organic Search, which simply means that traffic came to the site from a search engine result page. Someone searched, found your site in the listings, and clicked there as a result. It’s also often a good sign that your SEO efforts are working. It’s also worth noting that even within Google Analytics, you will still see some traffic counted from other networks like Bing, Yahoo and DuckDuckGo, and can even gain some limited insights on search terms that brought users to you.
Direct
Traffic categorized in Direct is most often visitors who went straight to your website. This could be from typing in your web address, using a bookmark, clicking straight to the site from a non-tracked third-party messaging source, a document file or another place. Often (but not always) these users are repeat visitors – returning to check for new products or updates – or those visiting as a result of an offline interaction, such as a business card or traditional advertising.
Referral
Another top category for traffic is Referral, which is another broad basket. Here, traffic is counted if it can be sourced as coming from another site. Common examples may be directory websites, chamber of commerce sites or other professional organizations that include a link to your business, though there may also be spam sources or other unexpected locations that send traffic your way. You can explore this more in depth by clicking the channel name and looking at the entries.
Social
Returning to more straight-forward categories, the Social traffic channel collects all users who came from any detectable social network. This will encompass all the networks you expect – Facebook, Twitter, LinkedIn, Instagram and Pinterest – but also platforms like Yelp. It’s important to note that this one can be tricky, as well, if you’re running paid campaigns on your social platforms – but this is something that can be adjusted with a little bit of code, as we’ll discuss.
Wonder how those weekly email blasts are performing as a portion of your overall website traffic? Check this category. Email breaks down any clicks that are detectable from an email campaign that you’ve created. This can often be easily connected and managed with many of the leading mass email platforms, so make sure that you’re properly configuring your scheduled emails and analytics to see how they help bring traffic to the site alongside other channels.
Paid Search
If you’re engaged in any pay-per-click or search marketing through Google Ads, those results can be connected to your Analytics account and parsed out in the data to show you the results. You can further differentiate this data by separate campaigns or strategies as well so that you can you compare different tactics or even different approaches, helping you see within this data set what options are bringing the most traffic or the lowest bounce rate.
Display
Similar to the Paid Search channel, Display tracks any advertising you’re doing with banner ads or other types of graphic placements. Breaking down this traffic can also show you the source of the ad traffic, helping you gauge which websites or platforms are most successful so that you can adjust placements or budgets further to help get the greatest impact from your paid campaigns.
(Other)
Lastly, there’s a sort of catch-all category available – (Other) – that can include a sort of hodgepodge of different traffic. This may include campaigns you set using UTM codes or other traffic that can’t be properly categorized into one of the other buckets. If you see a lot of traffic here, it may be a sign of improper settings on a campaign that should be reviewed and corrected to make sure you’re accounting for visitors from the right locations.

No, not sea urchins – Urchin Tracking Modules.
Customized Tracking with Little Urchins
While Google’s ability to categorize and sort traffic is impressive and robust, it doesn’t necessarily cover all potential cases that you may want to be able to track. As mentioned above, for example, what if you want to differentiate traffic sent to the site from a paid Facebook campaign? Or what about traffic that came from a specific outreach email that your sales team sent out? Enter the urchins – Urchin Tracking Modules.
These snippets of code are simply appended to the end of a link to pass along a series of parameters to Google Analytics (and many other utilities, as well) that can differentiate traffic that arrives from that link. There are five customizable fields – source, medium, campaign, term and content – which can be labeled to clearly illustrate campaign traffic within your analytics platform.
The UTM link will end up looking a bit long (like jfitzgeraldgroup.com/blog?utm_content=BLOGTITLE&utm_medium=BLOG&utm_source=JFGWEBSITE), but with embedded links or links included in a clickable post, can be innocuous to the end user while providing you with valuable insights. Google even offers a handy tool to help make the process simpler and streamline making your own UTM-enabled links.
What is Behavior in Google Analytics?
So now you know how your website visitors arrived – but then what? That’s where behavior tracking steps in.
This tab in your Google Analytics gives you a chance to look broadly at how all of your website traffic engaged with the different pages on your site – and offers a pretty handy “waterfall” view of interaction. When you click to Behavior, the main page will show you all your traffic and the top visited pages. Here you can get an at-a-glance understanding of your most popular pages, which is a great way to understand what garners the most attention from your visitors or even what pages are the most popular first page or landing page for people.
 How to Read Behavior Flow in Analytics
The next option in the Behavior menu is Behavior Flow, which provides a more visual option to see how traffic moves through the site. From left to right, this screen shows start pages and draws lines to the next column, showing thicker waves for higher volumes of traffic and making it easy to see the broader trends in user movement.
Both reports can also be filtered to show you only specific portions of your traffic. For example, if you want to compare how users who arrive at the site organically from search compare with those who visited because of a specific paid campaign, you could filter the report and review the page data to look for trends or similarities.
Finally, you can step back entirely and look at some of your traffic trends using the same filters. On the Audience tab, you’ll find some overarching stat lines – some are straightforward totals for figures like users, sessions and pageviews, while others provide more usable insights. Average session duration tells you how long people spend on site in a typical visit, while bounce rate running high can show that people are finding you but not for the right reasons.
Real Data, Real Insights – Real Results
Understanding and reviewing your analytics isn’t reading the tea leaves – it’s using the data at your fingertips to act smartly. Knowing what is working well allows you to invest in those channels, boosting your performance and your bottom line. Determining what isn’t helps you trim the fat from campaigns that aren’t giving you a great return or identify ways and places you need to improve in your marketing or your website.
Working with a partner like JFG, you’ll find that we love to use data. It tells a story – but only if you know how to read it. Thankfully, our digital marketers are pretty fluent in the language of data, and can help understand your story – and rewrite it to have a happier ending. Let’s chat – give us a call, connect with us on Facebook or send us an email and talk about what you want to achieve and how we can help you get there.